R functions for regression analysis cheat sheet
29th May 2012
Posted in Bioinformatics, Links, Misc | No Comments »
29th May 2012
Posted in Bioinformatics, Links, Misc | No Comments »
29th May 2012
Usually I’m using 10-fold (non-stratified) CV to measure the predictive power of the models: it gives consistent results, and is easy to perform (at least on smaller datasets).
Just came across the Akaike’s InforÂmaÂtion Criterion (AIC) and Schwarz Bayesian InforÂmaÂtion Criterion (BIC). Citing robjhyndman,
AsympÂtotÂiÂcally, minÂiÂmizÂing the AIC is equivÂaÂlent to minÂiÂmizÂing the CV value. This is true for any model (Stone 1977), not just linÂear modÂels. It is this propÂerty that makes the AIC so useÂful in model selecÂtion when the purÂpose is prediction.
…
Because of the heavÂier penalty, the model choÂsen by BIC is either the same as that choÂsen by AIC, or one with fewer terms. AsympÂtotÂiÂcally, for linÂear modÂels minÂiÂmizÂing BIC is equivÂaÂlent to leave–v–out cross-​​validation when v = n[1-1/(log(n)-1)] (Shao 1997).
Want to try AIC and maybe BIC on my models. Conveniently, both functions exist in R.
Posted in Bioinformatics, Machine learning | No Comments »
29th March 2010
Posted in Bioinformatics, Links, Science, Systems Biology | 1 Comment »
24th January 2010
 MathIsFun offers nicely illustrated pages on math, algebra, geometry and maybe more.
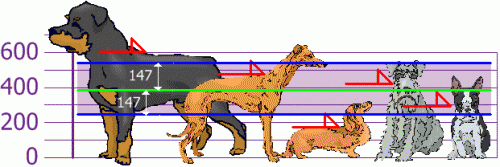
For example, there is a step-by-step instruction on calculating variance and standard deviation for a set of measured dog heights, with a final picture (below) illustrating one-sigma distance from the mean. Unfortunately, concepts of normal distribution and %% of data points within each sigma range are not discussed, but that might as well be too much for a nice explanation. There are also animations, like this mean machine. Overall, MathIsFun is a nice resource for younglings.

Posted in Links | No Comments »
14th September 2006
I am doing some simple statistics now, and had to review some basic concepts like standard deviation.
As a note to myself and anyone interested, here it stays.
The mean is just a sum of all your numerical observations, divided by the number of observations. E.g., if you have measured how tall your 5 children are, and got the values 1.42, 1.56, 1.05, 1.89, 1.92, the “mean height” of your children will be x = (1.42 + 1.56 + 1.05 + 1.89 + 1.92) / 5, x = 7.84 / 5 = 1.568 (all values in metres).
The mean itself doesn’t tell you much, however. If you had this 1.568 mean available, you wouldn’t know even the range of heights.
The standard deviation helps with this. First of all, it is measured in the same units as initial data – i.e. metres in our example. Second, it gives you an idea of how strongly do the measured values differ in your sample – the bigger the deviation, the longer is the value range measured in the sample.
Read the rest of this entry »
Posted in Science | No Comments »