Mean, standard deviation, and stem-and-leaf plot
14th September 2006
I am doing some simple statistics now, and had to review some basic concepts like standard deviation.
As a note to myself and anyone interested, here it stays.
The mean is just a sum of all your numerical observations, divided by the number of observations. E.g., if you have measured how tall your 5 children are, and got the values 1.42, 1.56, 1.05, 1.89, 1.92, the “mean height” of your children will be x = (1.42 + 1.56 + 1.05 + 1.89 + 1.92) / 5, x = 7.84 / 5 = 1.568 (all values in metres).
The mean itself doesn’t tell you much, however. If you had this 1.568 mean available, you wouldn’t know even the range of heights.
The standard deviation helps with this. First of all, it is measured in the same units as initial data – i.e. metres in our example. Second, it gives you an idea of how strongly do the measured values differ in your sample – the bigger the deviation, the longer is the value range measured in the sample.
Calculating standard deviation is simple (image © wikipedia):
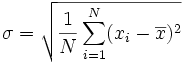
Here: N – number of data points (=5 in our example), x – mean, xi – each data point.
If we calculate sigma (standard deviation) for the example above, we will get:
σ = sqrt( ( (1.42-1.57)^2 + (1.56-1.57)^2 + (1.05-1.57)^2 + (1.89-1.57)^2 + (1.92-1.57)^2) / 5)
σ = sqrt( 0.023 + 0 + 0.27 + 0.102 + 0.122 / 5)
σ = sqrt( 0.517 / 5 )
σ = sqrt( 0.103 ) = 0.32 metres
So now, if you write you measurements like this:
height = 1.57+0.32
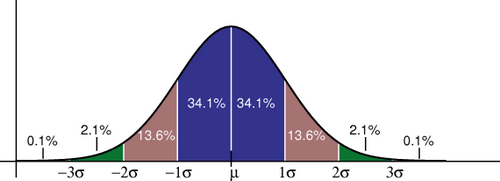
that will read like: “on average, my 5 children are 1.57 metres high, and most of them are from (1.57-0.32) to (1.57+0.32) metres high”. That “most” in the previous sentence actually means 68.2% of all data points (or children heights in this case) (image from wikipedia):
(More comprehensive version of this help image exists here:
Get larger version)
So if you want to include 95% of children heights, that will be (1.57-0.32*2) to (1.57+0.32*2), where 0.32 is the standard deviation we calculated above.
Now to the stem-and-leaf plot. Reading a book on statistics
For example, a pediatric registrar in a district general hospital is investigating the amount of lead in the urine of children from a nearby housing estate. In a particular street there are 15 children whose ages range from 1 year to under 16, and in a preliminary study the registrar has found the following amounts of urinary lead (μmol/24 h):
0.6, 2.6, 0.1, 1.1, 0.4, 2.0, 0.8, 1.3, 1.2, 1.5, 3.2, 1.7, 1.9, 1.9, 2.2
A simple way to order, and also to display, the data is to use a stem and leaf plot. To do this we need to abbreviate the observations to two significant digits. In the case of the urinary concentration data, the digit to the left of the decimal point is the “stem†and the digit to the right the “leaf â€. We first write the stems in order down the page. We then work along the data set, writing the leaves down “as they comeâ€. Thus, for the first data point, we write a 6 opposite the 0 stem, and so on:
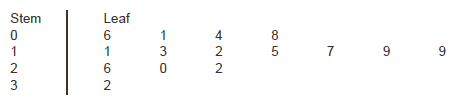
We then order the leaves:
The advantage of first setting the figures out in order of size and not simply feeding them straight from notes into a calculator (for example, to find their mean) is that the relation of each to the next can be looked at. Is there a steady progression, a noteworthy hump, a considerable gap? Simple inspection can disclose irregularities. Furthermore, a glance at the figures gives information on their range. The smallest value is 0.1 and the largest is 3.2 μmol/24 h.
Hope this helps you.

